Data ≠ Information
Big Data.
Every time I hear that buzz phrase whizzing around I have the inexplicable urge to smack it back into the hive.
According to Forrester Research the term ‘Big Data’ leads to major confusion. Big Surprise! But what do the leading dictionaries have to say about Big Data?
Data sets that are too large and complex to manipulate or interrogate with standard methods or tools. Oxford Dictionaries
vs
An accumulation of data that is too large and complex for processing by traditional database management tools. Merriam Webster
Very similar yet both very unenlightening, I dare say. ‘Too large and complex’ for ‘standard methods’ and ‘traditional database management tools’ to handle. At what point exactly does large become too large, and what constitute standard methods or traditional database management tools? Standards evolve, traditional database management tools improve, …
Forrester define Big Data as “the practices and technology that close the gap between the data available and the ability to turn that data into business insight.” Another ‘definition’ that fails to grasp the meaning of the word, even though it touches upon an important aspect: it shows the divorce of data from information. More data does not lead to more information. It is easy to generate loads of data but if the additional bytes do not increase the information you can access and act upon, the accumulated data has no value; if the data is stale before you can react to the information you extract from it, it is of no use.
One’s ability to predict historical data accurately (in-sample performance) may be quite different from one’s (in)ability to predict the future (out-of-sample performance), as recently demonstrated by Google. When you choose the model with the best in-sample performance you can negatively affect the out-of-sample performance if the system you study has memory (see Bailey et al. (2014) for a review of the dangers of backtest optimization in the finance industry). What is more, a pattern is not an insight.
Pattern ≠ Insight
The famous beer-and-diapers story perfectly demonstrates that a pattern does not lead to an insight, although you can indeed make money from a pattern. The pattern discovered was that between five and seven o’clock in the evening people often bought both beer and diapers at a particular chain of supermarkets. Since the market segment for beer is quite different from the main consumers of nappies, the pattern is in itself plenty interesting. The customers were presumably men with young families who went out to buy nappies and treated themselves to a complementary libation for an honest day’s work. Alternatively, the men went out because it was too dangerous for their wives or girlfriends to go out alone in the evening, or because the women did not want to leave the house because of bad weather. Or because the men were thirsty and knew their partners would not buy nappies for the baby as well as beer for the bigger baby. Or these men came home from work, heard the baby cry as loud as thunder, and went back out to get away from the horrors of their homes. The true insight would have been if the analysts had figured out why the men bought both items from their stores. If, on the one hand, the neighbourhoods these shops were located in were too dangerous for women to walk the streets unaccompanied, the supermarkets might have offered items for personal protection. If, on the other hand, the men were sick of the sound of screaming children and/or nagging spouses, the shopkeepers might have made more money on beer-and-earplugs deals or magazines that discussed the various ways to safeguard your assets in a divorce.
The beer-and-diaper anecdote may well be silly, but I think it demonstrates the distinction between data and insight rather well. Many businesses can obviously make a fortune by knowing patterns in their customers’ behaviour or by clustering customers based on certain characteristics, so that each group can be targeted individually. Two important, related questions are 1) whether your business can live with the fact that you have no idea what causes statistical dependencies in your data, and 2) whether you can afford the additional effort to go from pattern to insight.
For retail businesses I sincerely doubt that the additional effort can be justified in all cases: if your data-driven models predict customer behaviour sufficiently accurately, then you can already start to use that information to your advantage. Pharmaceuticals companies, however, definitely need to understand why a certain medicine is more effective than others in order to develop the next generation of medication. Lithium, for instance, is often used to treat symptoms of people who suffer from bipolar disorder, but currently no one really knows how and why it works. As such, not many effective alternatives for long-term treatment of bipolar disorder exist at the moment.
Once you have decided that you need insight more than mere patterns, you have to be aware of the correlation-does-not-imply-causation fallacy. Confounding variables can quickly lead to spurious correlations being mistaken for causations. Great examples of spurious correlations are collected by Tyler Vigen. My personal favourite is that the per-capita consumption of cheese in the USA is highly correlated to—not caused by!—the number of people who die by becoming tangled in their bed sheets. Up until the point when I reached that particular chart I had not known that people actually died from involuntary, self-inflicted bed-linen strangulations.
The erroneous notion, purported by many a vendor who stands to capitalize on selling Big Data and the even bigger cloud of promises surrounding it, that more data automatically leads to more information, has not gone unnoticed:
[M]odern data analysis is supported by the belief that sufficiently large data collected from a phenomenon will allow one to answer any question about the phenomenon itself if treated with appropriate methods and assisted by powerful enough algorithms. Napoletani et al. (2014)
They go on to write that the ‘information’ gleaned by means of such data analyses does “not carry any structural understanding beyond the actual solution of the problem itself”, which is exactly what I mean by patterns not being equal to insights.
The Next Big Thing
In a recent McKinsey Insights report it is said that
Big Data represents a transformational shift for the business and a once-in-a-generation opportunity for CIOs to help their companies accelerate bold changes and generate vast value.
What is most interesting about the report is that it has lots of words but very little insight pertaining to Big Data. The authors write that data quality is critical. (Hardly a surprise!) Top talent is key to successful Big Data programmes. (When did having skilled employees stop being important? You can hardly run a successful enterprise with a bunch of amateurs.) Furthermore, they emphasize the importance of a CIO’s ownership and accountability when it comes to the analytics solutions for internal customers. Basically, what they endorse is data governance.
That leads me to the question: Is Big Data a fad?
No. Data is more varied and bountiful than ever before. People consume and generate more and more data every day. Some of that data is still highly structured but the vast majority definitely isn’t: metadata, text, images, audio, video, and so on. ‘Traditional database management tools’ (i.e. relational database management systems) can sometimes be forced to deal with semi-structured data but they may not be as efficient; they were never conceived to deal with the level of ‘complexity’ that is required nowadays.
What I do not believe is that Big Data is a revolution. I see it more as a paradigm shift, not unlike shifts in programming paradigms. The amount of data in the world has not suddenly spiked to whole new levels. Instead, it has grown exponentially yet naturally. Similarly, the tools with which we attack data problems have evolved. I doubt that anyone would consider object-oriented programming a genuine revolution. It was, nevertheless, a significant shift that was demanded by needs that required more than what ‘standard methods’ (e.g. procedural programming languages) had to offer.
Is Big Data as big as one is led to believe?
Tough one. Some believe that Big Data will bring about the next industrial revolution. In Germany there is even a name for it: Industry 4.0, which is all about highly connected manufacturing environments. Still, the productivity gains from the previous ‘industrial’ revolution (i.e. information technology) are still very much up for debate. Hence, I am a bit apprehensive to call it a revolution yet.
There is currently a wave of companies who are eager to jump on the bandwagon even though they understand precious little about the prerequisites, especially with regard to data governance. Their Big Data initiatives are done more because of pressure from management who have read about it in magazines and because of opportunity costs rather than as a consequence of acute business needs.
Some businesses generate mind-boggling amounts of data and they can benefit greatly by making sure that they understand patterns in their data as thoroughly as possible. Mind you, I wrote ‘understand’ not just ‘visualize’. Others are probably best off sticking to tried-and-tested technology that can be improved upon gradually: we must learn to walk before we can run. There is no value in hoarding more data if you cannot glean more actionable information from it, which leads me to a question that has vexed me ever since I started thinking about this post:
What is the Value of a Megabyte?
It is true that in recent years the amount of data collected has skyrocketed. It is also true that the variation of the type of data has greatly increased. But what is not so clear, at least to me, is whether the value of a megabyte has increased dramatically since the advent of Big Data. If everything we store can somehow be ‘mined’ for valuable information that would otherwise remain elusive, Big Data companies should be on a roll.
Let’s take a look at Netflix, which is infamous for the loads of data it inflicts upon network cables.
The numbers I have compiled come mainly from quarterly letters to shareholders and financial statements, from which I extracted the number of streaming subscribers in the USA (‘domestic members’), revenue, and the basic number of shares outstanding, which, combined with historical stock prices, yields the market capitalization, which is a measure of Netflix’s value. Furthermore, I gathered information on upstream median1 network traffic in North America from semi-annual Global Internet Phenomena reports by Sandvine.2 What’s important to determine the value of an MB at Netflix is obviously the amount of data subscribers beam back to the mother ship, not what they stream to their devices.
Another reason why I (only) consider Netflix is that the contribution of their subscribers to upstream traffic has constantly popped up since at least 2011 in the documents published by Sandvine. I could find neither reports dating back to 2010 and before, nor other Big Data companies that were consistently present in the reports available. Data on corporate metadata is a extremely scarce even though abundant.
Before I proceed with the results, I must admit that my analysis is not exhaustive. Far from it really. It is, however, quite difficult to access the data from public sources. Most companies do not publish figures on the amounts of data they store per user. Netflix does not either, which is why I had to collect information from various sources and ended up with only one Big Data company that lent itself to analysis.
Back to business… In the chart below I show Netflix’s value (top panel) and revenue (middle panel) per megabyte in dollars, adjusted for inflation based on the CPI, which I took from Wolfram Alpha. The figures are for American subscribers to streaming services only. The solid lines show third-order polynomial smoothing curves based on a generalized additive model (GAM) with 95% confidence bands.
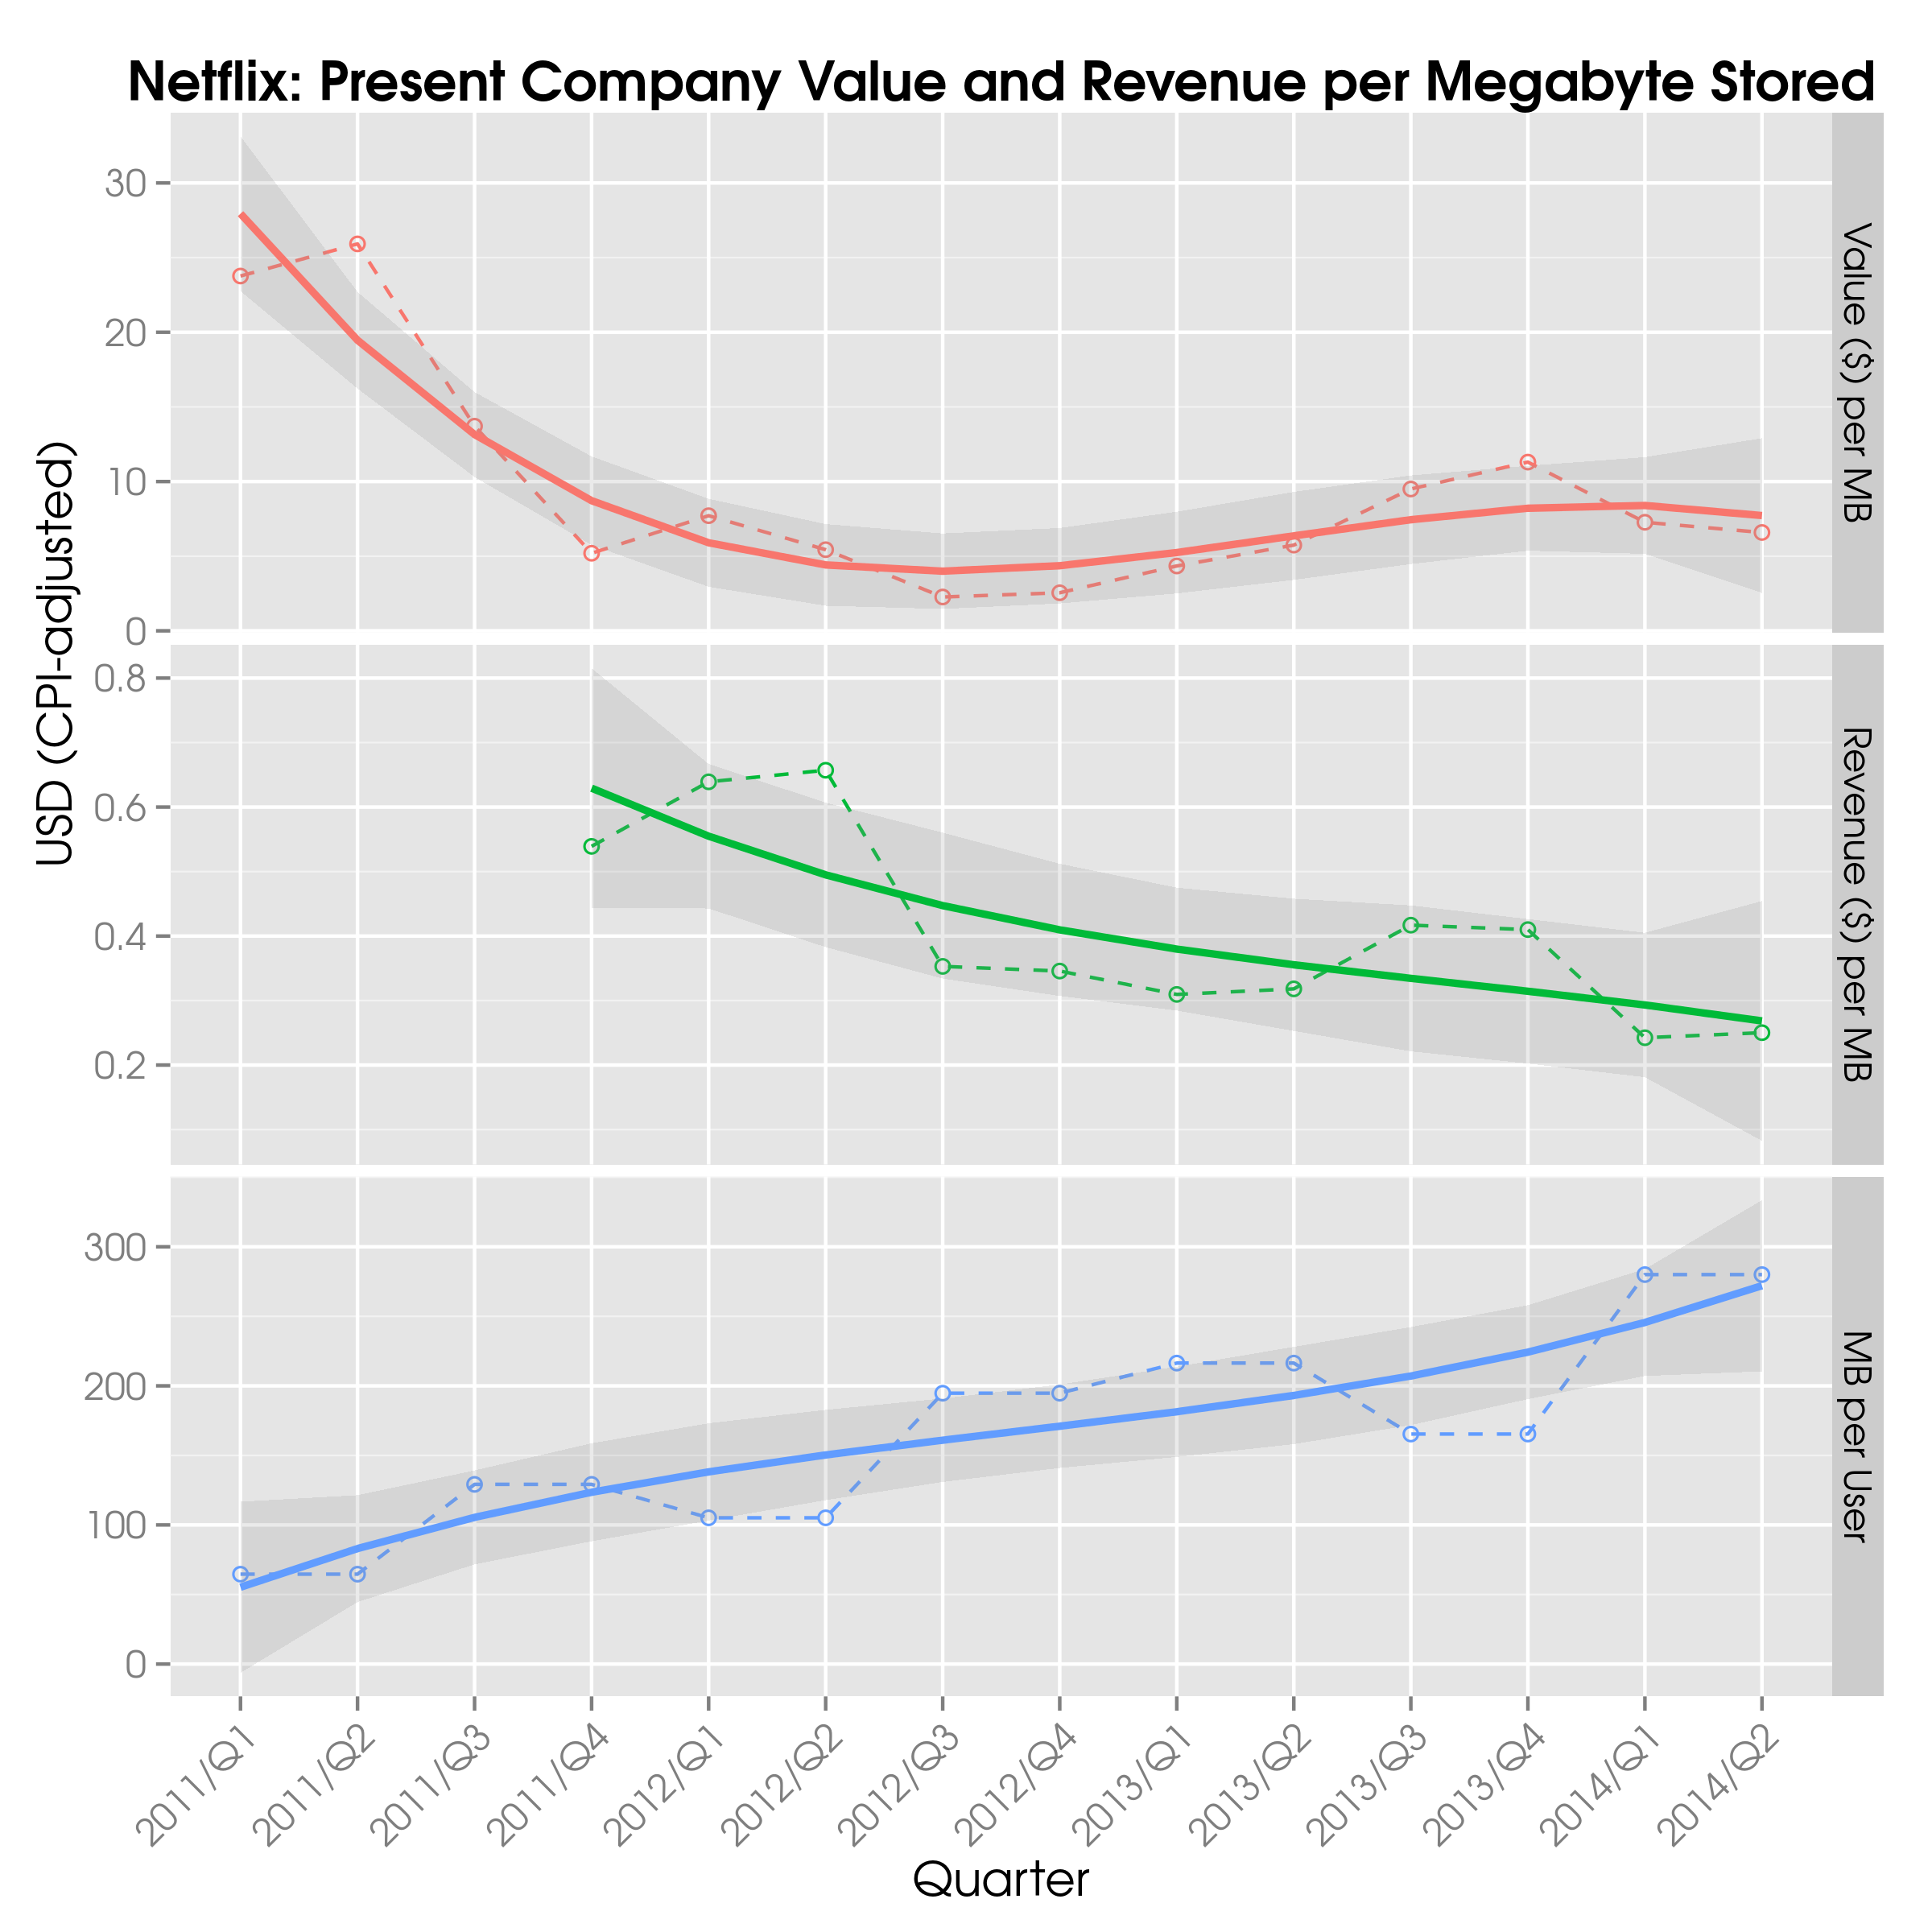
It is clear that there is a blip in the data near the end of 2011, which is mainly due to policy changes that led to many (non-streaming) members cancelling their subscriptions. Consequently, the stock price dropped and thus the market capitalization. Since Netflix did not publish revenue figures for streaming subscribers before 2011/Q4 separately, that data is absent from the middle panel. I’m going to take a stab in the dark and presume that the reason they started displaying the revenue for both streaming and DVD-by-mail members was due to the huge drop in the stock price. From 2012/Q3 to 2014/Q1, the stock price has climbed continuously.
The amount of data stored per user per quarter (bottom panel) has steadily increased to its current value of approximately 280 MB. In fact, the correlation between the market capitalization and the median amount of data sent back to HQ by each subscriber is significant but meagre at 0.21 (i.e. Kendall’s correlation coefficient3 with a test statistic of 1.0464 and a p-value of 0.2954 at a level of significance of 5%).
Hence, I am tempted to conclude that each additional megabyte per user adds very little value to the company, which implies that very little additional value can be mined from more data. That is more or less what I said at the very beginning: more data does not imply more information.
A splendid example of the hype surrounding Big Data is a recent article about how Big Data is preventing suicides today. If you care to read the article in its entirety you’ll notice it’s about a project, the Durkheim Project, which “hop[es] to find interlinked dialogue […] that can pinpoint the problem.” So, Big Data is not yet preventing suicides even though the title says so.4 Somehow the actual implementation seems irrelevant: “throw more data at the problem and the problem will solve itself” seems to be the adage.
I’m not against Big Data. On the contrary! What I do oppose is unfettered and baseless optimism about the promises of Big Data. I think it has a lot of potential, and as the great contemporary philosopher Dylan Moran said:
Potential is like your bank balance: you always have a lot less than you think.
Big Data?
Big Deal!
An abridged version of this article appeared on Datafloq.
-
Why the median? Well, typically only a small number of users (key or power users) are responsible for the majority of data traffic. The mean, as reported by Sandvine, is therefore much larger than the median as it is more sensitive to these outliers. Since I do not want the results to be skewed by a relatively small portion of streaming addicts, I have chosen the median, which is more representative of the general Netflix customer. ↩
-
I have tacitly assumed that internet users in North America are pretty much the same lot as Netflix (streaming) subscribers in the USA when it comes to data habits, which I believe is a fair assumption. Moreover, I assume that the benefits from Big Data are ongoing and not one-offs. It is of course impossible to compare Netflix to a Netflix without Big Data, that is a Netflix in a parallel universe, and see whether not mining user metadata would have been a viable business model. ↩
-
Pearson’s (product-moment) correlation coefficient measures linear dependencies between random variables, whereas Spearman’s measures monotonic relationships. The latter is also more robust to outliers. Even though Pearsons’ correlation does not assume normality, its distribution is not robust when faced with data that is not normally distributed. For large data sets the lack of normality does not matter much thanks to the central limit theorem, but for small data sets, such as the one discussed, Spearman’s is generally to be preferred. Note that for Kendall’s correlation, confidence intervals can be computed more reliably than for Spearman’s. ↩
-
Preliminary results by the project’s researchers have been published in PLOS ONE: “Our data […] suggests that computerized text analytics can be applied to unstructured medical records to estimate the risk of suicide.” The authors have achieved a 65% accuracy with their model, but they highlight the limitations of their study: “[W]e would need further research on larger data sets in order to validate our findings before attempting clinical testing. […] Finally, our approach was retrospective by design and we have yet to demonstrate the ability of this approach to predict suicide prospectively in a clinical cohort [italics added].” ↩