The Data Quality Doctor
When it comes to data quality, many companies are still stuck in firefighting mode: whenever a problem arises, a quick fix is introduced, often without proper documentation, after which the problem is filed under ‘H’ for “hopefully not my problem the next time around”. The patches are often temporary, haphazard, and cause more problems downstream than they really solve. In most instances there is no obvious reason for it, which makes a bad situation worse. It reminds me of the saying that the treatment is worse than the disease, so it’s time to bring in the doctor…
Data Quality
Data Quality (DQ) is a vague term. IBM describe it as “an essential characteristic that determines the reliability of data for making decisions”, which is determined by four key components: completeness, accuracy, availability and, for the lack of a better word, currentness. IBM’s definition is probably as close as you can get to the truth without being overly simplistic and pompous.
DQ is something we can all relate to as it affects all projects that touch upon data. Since there is no universal scale that measures the quality of data, we often have to make do with half-baked measures to tackle issues with data. There is, however, one thing regarding data quality that is universal: no one wants to fix the one location where the data needs to be clean: the source. Any solution that does not involve fixing the cause of the problem is only temporary and thus a waste of time.
To illustrate the problem, let’s take a look at a project I used to work on. I’ll show you how to identify the ‘anti-pattern’, and what you can do about it.
Semiconductor Manufacturing
The fabrication of semiconductors is without a doubt one of the most complex manufacturing processes. Silicon wafers are placed in carriers (or FOUPs) that can hold up to 25 wafers, and these so-called lots can go through several hundred processing steps over the course of several weeks. Single process times range from a few hours to more than a day. Since most tools are expensive there are no assembly lines, and lots visit the same tools many times. There is also a great variety in the way the tools process lots: single-wafer tools, where wafers are processed sequentially or in parallel, single-lot tools, in which each lot is processed separately, and batch tools, for which multiple lots are loaded onto the tool, after which the batch is processed as a whole. There are also standalone and cluster tools.
Older semiconductor fabrication plants (fabs), usually processing wafers of 8 inches in diameter and below, are typically operated manually, whereas the modern 12-inch facilities are fully automated. Some fabs, nevertheless, are semi-automated in the sense that some tool sets are still loaded manually while other (sequences of) tool sets are taken care of by conveyor systems and robots and/or handlers.
As you can imagine, a panoply of data can be gathered from the software systems that live in these facilities: manufacturing execution system (MES), which is the backbone of the fab, equipment integration (EI), automated material handling system (AMHS), recipe management, statistical or advanced process control (SPC/APC) with fault detection & classification (FDC) and run-to-run (R2R) control, out-of-control plans (OCAPs), equipment-performance tracker (EPT), and so on.
Tool Events
What I want to focus on is what happens to the tool events that the EI broadcasts and the EPT receives. These events, together with the information from other applications, most notably the MES, allow you to reconstruct the status of each lot and tool in the facility, and from that calculate the tools’ operational efficiency (OEE). Industrial engineers can infer from that information where time is lost, after which they can define and prioritize kaizen projects to continuously improve the operations of the fab. Besides, it is important for production planners too, as the information allows them to avoid costly and unnecessary investments by pointing out optimization opportunities.
As we shall see, the events themselves are generally not enough, so we have to enrich these with data from other source systems. Such enhancements are usually done in a data warehouse, into which all relevant source data flows. The SEMI E10/E79 standard is a start, but for more advanced analyses of efficiency and productivity a finer-grained model is commonly adopted by fabs around the globe.
A simplified example of tool events and states is shown in the figure below. The cyan boxes are the tool events. The blue (dashed) boxes show generic events that are not directly related to the tool, such as lots arriving at the tool.
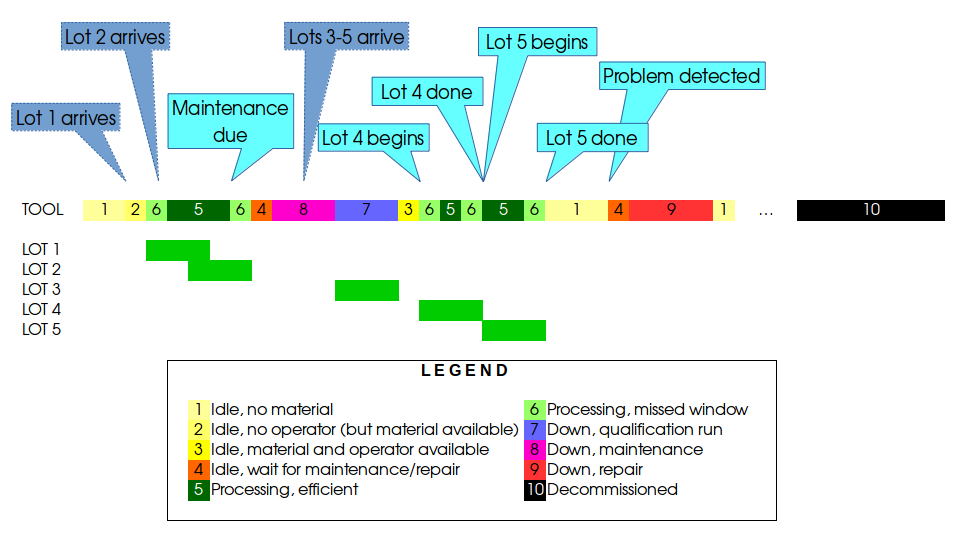
The tool events for lots 4 and 5 show what a typical tool tells us: when the tool starts processing a lot and when it’s finished processing a lot. What we have to infer is whether the time is actually spent processing lots efficiently. If we look back to lots 1 and 2, we see that the tool can start processing a second lot while it’s still working on the first one, which is known as a cascade or train. Lot 5 starts after lot 4 has finished, so we log the time at the end of lot 4 as ‘Processing, missed window’. The tool is indeed processing lot 4, but it’s not as efficient as it could be. We typically infer this time window for cascades from historical data or we get the information from process engineers, although that information usually comes with a complementary grain of salt.
Now, let’s take a look at lot 3. It comes right after a maintenance, so that this lot is usually a qualification lot, or qual for short; since the tool has not yet been released (i.e. qualified) for production we still consider this time as downtime. For fully automated fabs the information about quals is commonly found in the MES, but for non-automated fabs a qual lot can sometimes be run manually, so that we have no information in the MES, just the tool saying that it is processing something. This is another example for which we have to fill in the blanks by integrating data from multiple sources.
Before lot 1 arrives, the tool is on standby. However, there is no material to process, which we know from the MES, so we classify the time as ‘idle, no material’. Once lot 1 is in front of the tool, the tool is not immediately processing it, for instance because there is no operator to load it onto the tool, hence the category ‘idle, no operator’. When the tool is done with lot 2 we have another period of tool idleness that is different: a maintenance is due, so whether there is material and/or an operator available is irrelevant, for the tool is waiting for maintenance.
On the right, we see that after a (hopefully) very long time, the tool is taken offline. Some systems do not allow tools to be removed as that would involve deleting all related records, so they are generally set to a state like ‘decommissioned’. It is within the purview of each application to deal with hiding such tools from reports and the like.
Missed Events
So, what does this have to do with data quality?
A lot.
All production systems in fabs have built-in redundancies to avoid a single point of failure. Furthermore, the EI and EPT mostly use asynchronous communication protocols, such as message queues, to avoid events being lost due to one of the recipients being unavailable.
Where it becomes more interesting is the tools. Tools are not all made the same, so the amount and content of the events varies from tool to tool, even for different tools from the same vendor. Some tools ensure that all events are broadcast, whereas others occasionally lose a few events. Not all tools, especially older ones or custom-built machines, are SECS-compliant, so there are various reasons for tool events being not what they could or even should be. Moreover, some even slip through the EI, for instance when it has been configured improperly; it happens.
As a data warehouse developer you have to make sure that the data coming in is accurate as otherwise the data coming out would be useless. Now imagine that an event in one of the sources is lost, so it’s not a data integration problem. What are the consequences? Well, for starters, the classification of the time bucket is incorrect and the next event makes no sense. For example, assume the tool was idle when we were not notified of the beginning of the maintenance. When the tool eventually says it’s done with the maintenance, we’re confused. What maintenance? When did it start? Why? Since we have no idea when the maintenance actually started we cannot fill in the blanks this time. Furthermore, what if the end-of-maintenance event was wrongly configured in the EI and there was no maintenance at all? In the previous example, lot 3 could thus be a production lot, not a qual.
If the erroneous event is systemic, then the OEE would be off, and the plant could end up ordering tools no one really needs. If it’s a random error, then we’re not as accurate as we could be, but we can only hope that the calculation is on average close to reality. Accurate events are also critical to a scheduling system, which makes the decision which lot goes on which tool at what time. If it makes a wrong decision based on inaccurate or incomplete data, the output of the entire fab may go down as a result.
Round 1
When you go to the owners of the source systems, it’s not uncommon to hear that it’s not their problem, so you have to deal with it. Sometimes they try and be helpful by suggesting that you use the typical maintenance time and work out the likely start time from the end-of-maintenance event.
It’s an option but not a very good one. A lot of iffy assumptions have go into that solution to make it work: the maintenance time has to be pretty constant and there has to be an available maintenance engineer. How do we know when someone from the maintenance staff was ready to perform the task. Did he or she have all the necessary items or was there some time lost searching for spare parts? Information about maintenance is not always tracked, and if we already know that events can be off, how can we be sure that historical information is accurate enough?
Moreover, industrial engineers try to continuously improve processes, including maintenance, so if there has been a recent effort to cut down on the time to do routine maintenance operations, the allocation of time may be way off.
Round 2
“OK, so use your best guess or trend analysis on maintenance times.”
Nice one! In order to classify a single event, the data warehouse has to have a complete and up-to-date trend analysis on maintenance by tool. Furthermore, it does not settle the question what function or distribution to fit through the data.
And even if the proposed solution would work for maintenance, repairs are likely to escape your efforts. Repairs are notorious for being unpredictable, so the time each repair takes varies from tool to tool and from repair to repair, even from engineer to engineer.
Quite a bit of horsepower is needed to check all relevant possibilities for all events all the time. And what about outliers?
Round 3
“Throw them out.”
So, we need either a complete statistical model for each tool and its maintenance schedule, or kick out data outside of an arbitrary, predetermined range.
Round 4
“Remove the top and bottom 10%.”
Why 10%? If we remove all ‘outliers’ based on that logic we would delete a lot of good data too, especially for processing times. The top 10% probably contains the reference values we should compare ourselves against when we look at efficiency losses.
What is even worse is that not all tools are the same; a similar maintenance procedure can take a lot longer on another tool because it’s built differently or it’s located in a spot where the engineer cannot access all parts as easily as with the other tool.
Round 5
“Make the logic tool-dependent.”
Farewell, standardization! The whole idea of the automatic classification of times between events hinges upon a standard set of events.
Round 6
“You have to make exceptions for maintenance and repairs.”
Why stop there? Development lots often have unpredictable processing times, especially if a new technology is experimented with.
Round 7
“That too.”
Blimey!
The Anti-Pattern and Its Resolution
I could go on but usually after a few rounds with the various solution owners you throw in the towel and pursue an alternate strategy. The problem with solving issues with data quality in a data warehouse or the integration scripts is that it’s not transparent and it solves absolutely nothing.
First, because no one except the data integration team members know the logic behind the reinterpretation of events and reclassification of times between events, you have code that is difficult to understand, a pain to explain, and impossible to maintain. You are also prone to depend too much on data that is liable to change quickly; what if someone changes the configuration of the EI to solve an unrelated problem, and you are blissfully unaware of it? Oops!
Second, the moment you introduce a quick fix, another issue pops up. Then you have to fix that one, then the one that follows that one, and thus you continue until you retire or are finally fed up with the tedium that is known as your job and quit.
Someone once proposed a timer that cannot be exceeded as the silver bullet for event problems. The problem is that tools sometimes are set in a decommissioned state before they are moved to another physical location within the fab. Sure, we can make an exception for ‘decommissioned’ but tomorrow you discover that there is another exceptional case and the day after that another one.
It’s like going to a doctor with a slight headache, coming back from the pharmacist with hundreds of pills and potions to end up in the hospital to have your legs amputated because of all the side effects, when all you needed was some peace and quiet.
But what can you do?
A solution that has worked well in the past involves two steps:
Step 1: The X-Ray
Make sure you know what the problem is and show it. Clearly. Don’t try and patch it, expose it. You have to see the problem it all its glory before you can attempt to fix it.
When dealing with bad events as described earlier, we introduced another level in the classification hierarchy at the very top. We replicated the entire set of tool states, so that there was an ‘idle, no material’ for correct and incorrect event sequences. All we had to do was figure out all possible sequences and list them, which — thanks to standardized tool events — was an easy-peasy exercise. Each incoming event was inspected based on the previous one and then listed as either belonging to a correct or incorrect event sequence.
In the example above we would have the time between the end of lot 2’s processing and the end of lot 3’s processing reclassified as potentially wrong. The key here is ‘potentially’ though. The processing of lot 3 is not wrong but its classification as production or qualification may be, so it was included in the group ‘incorrect event sequence’ where the event that triggered that label was clearly marked. Only the first lot after maintenance may need to be classified as a qual, so after lot 3 is done, we again have a correct event sequence.
All internal calculations for operational metrics (e.g. OEE, cycle time, throughput) used only the data from correct event sequences, so we automatically got rid of all potentially wrong data points without having to resort to unwieldy statistical analyses or outlier detection and removal procedures, which are not always as accurate as people think.
The advantage of our solution was that it showed the extent of the problem. For certain tools we never missed an event, so the charts were perfect. Done. For some we lost one or two events (out of thousands) a day, so our reports reflected that. If one of these tools was a bottleneck, we occasionally had to investigate and propose solutions but most of the time people did not really care. Other machines were a bigger issue, as it seemed to be the rule rather than the exception for them to drop or mislabel events. All of a sudden, everyone could see the problems, which is the key to the next step.
Step 2: The Surgery
Because the issues are clearly highlighted and people outside of the data warehouse team are talking about them, they are likely to get the attention they deserve. Once an issue is on the radar of people (with authority) who rely on high-quality data to make business decisions, you can more easily talk to the owners of the source systems to have the problems fixed. It’s suddenly not just your problem any longer.
Because you have visualized the errors you have already done your fair share. It’s much harder for people to maintain their position that it’s your task to fix things that are obviously wrong in their systems. When you share the pain with people outside your own team, they are likely to look for a remedy too, which speeds up the overall healing process.
Summary
I have said it before: a data warehouse is never done. It’s a process that needs to be improved upon continuously.
Whenever issues come up, make sure you understand the root of the problem. Make it visible and solve it as close to the source as possible. It’s a simple two-step process that has served me fairly well in the past:
- Expose: show the problem and its extent.
- Excise: remove the cause of the problem.
The first step often requires additional work from the data warehouse team that you may not want to do, but I can assure you that going from data chaos to high-quality data is not something that just happens overnight or can be done by the data integration team alone. Be prepared to go the extra mile and show where the organization’s biggest data issues are and solve them together with the respective business owners. Don’t fight the symptoms when you can cure the disease.